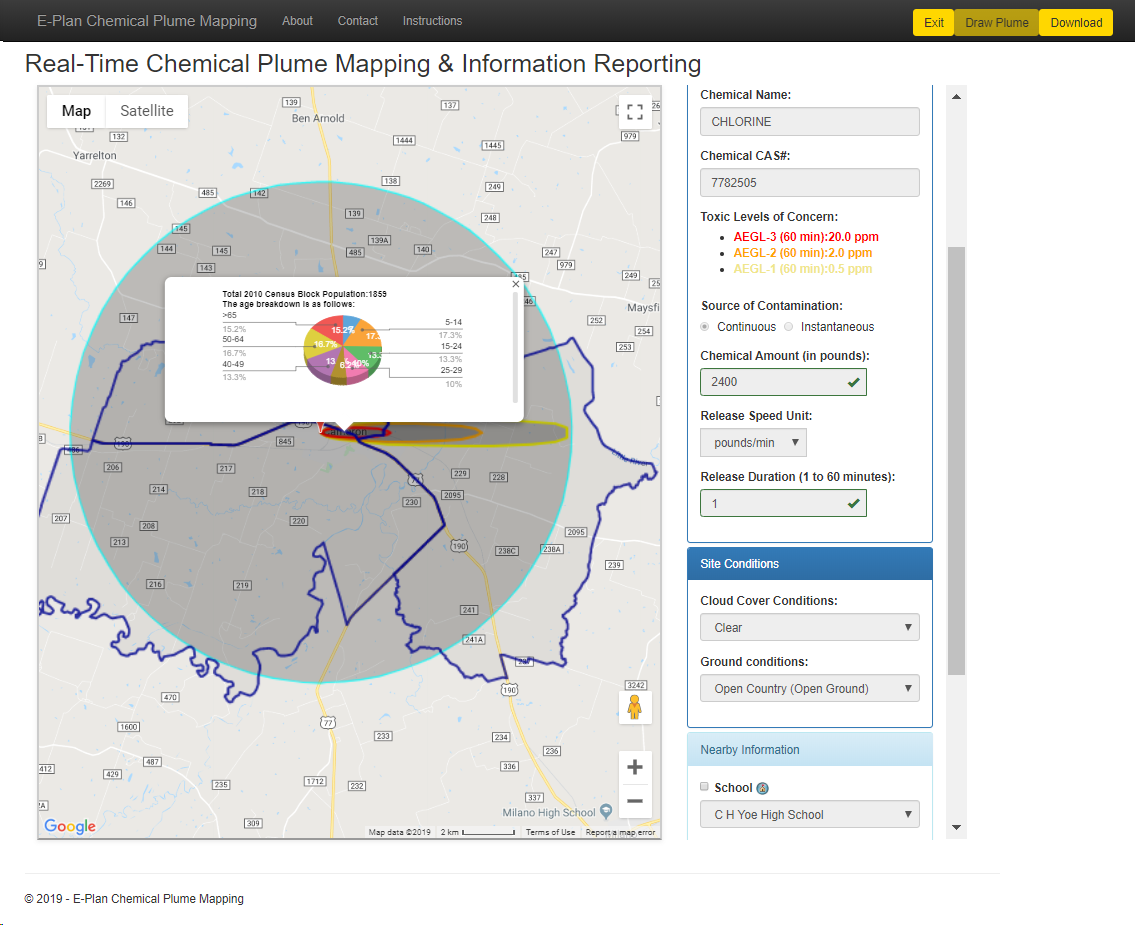
Displaying Census Information
- Click on any of the blocks denoted by the polygons to get the detailed census information for that block
- The pie chart shows the percentage distribution of population across the different age groups ranging from 5-14 years, 15-24 years, 25-29 years, 40-49 years, 50-64 years, and more than 65 years of age.